Xiao A and Xiao S are ACM teammates. Xiao A has excellent eyesight and often notices strange patterns in data.
During a training session, Xiao S drew a circle on a piece of paper. Xiao A took one look and said, "This is clearly a regular 17-gon!" He then brought out many pictures of regular polygons for Xiao S to observe. However, Xiao S had no clue, so he asked for your help to identify them.
Specifically, given the maximum number of sides $n$ of the polygon, Xiao A generated $N$ points on a plane using the following method:
- First, a point $(x, y)$ is chosen as the center. This point may be fixed at $(0, 0)$, or it may be chosen uniformly from $[-1, 1] \times [-1, 1]$.
- An integer $k$ is chosen uniformly at random from $[\max(3, n-5), n]$.
- Consider a circle with center $(x, y)$ and radius $1$. A regular $k$-gon inscribed in this circle is chosen uniformly at random.
- This is repeated $N$ times: in each iteration, a point $u$ is chosen uniformly at random from the boundary of the regular $k$-gon, and $\hat u = u + \mathcal N$ is added to the data. Here, $\mathcal N$ is a random noise whose two coordinates independently follow a Gaussian distribution with mean $0$ and standard deviation $0.01$.
- All the above random processes are independent.
You need to recover the number of sides $k$ of the polygon from these $N$ points.
Input
Read the data from standard input.
This problem contains multiple test cases. The first line contains a positive integer $T$, representing the number of test cases.
For each test case, the first line contains two positive integers $N$ and $n$, representing the number of points and the maximum possible number of sides of the polygon, respectively. The following $N$ lines each contain two floating-point numbers $\hat u_x, \hat u_y$, representing the coordinates of a point $\hat u$. All floating-point numbers in the input are given with $6$ significant digits.
Output
Output to standard output.
For each test case, output a single integer $k$ representing the number of sides of the polygon.
Examples
Input 1
(See the provided file)
Output 1
(See the provided file)
Note
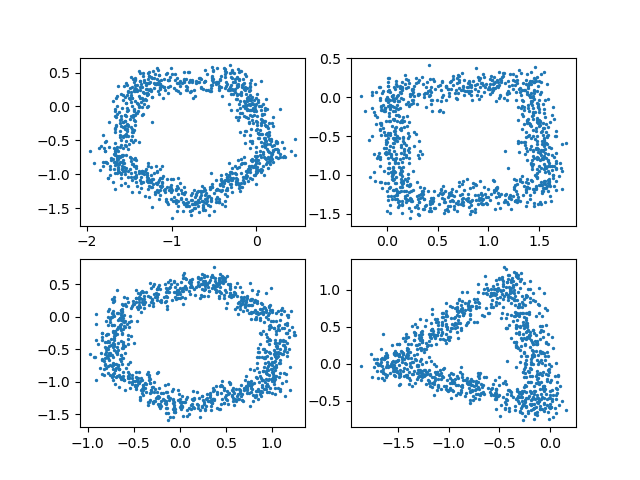
The following are visualizations of the 2nd, 4th, 5th, and 8th test cases from the sample, respectively.
Subtasks
For all test cases, $T=200$, $N=1000$, $3 \le n \le 30$.
There are ten test cases in total, each worth ten points. The test cases are not bundled.
| Test Case ID | $n \le$ | Center Selection Method |
|---|---|---|
| 1 | $4$ | Uniformly chosen from $[-1,1] \times [-1,1]$ |
| 2 | Fixed at $(0,0)$ | |
| 3 | $10$ | Uniformly chosen from $[-1,1] \times [-1,1]$ |
| 4 | Fixed at $(0,0)$ | |
| 5 | $20$ | Uniformly chosen from $[-1,1] \times [-1,1]$ |
| 6 | Fixed at $(0,0)$ | |
| 7 | $25$ | Uniformly chosen from $[-1,1] \times [-1,1]$ |
| 8 | Fixed at $(0,0)$ | |
| 9 | $30$ | Uniformly chosen from $[-1,1] \times [-1,1]$ |
| 10 | Fixed at $(0,0)$ |
Scoring
For each test case, if you get at most one test data incorrect, you will receive full points; otherwise, you will receive no points.
Note
You may need the following mathematical definitions, but not understanding them will not affect your ability to solve the problem:
A random variable $X$ following a Gaussian distribution $\mathcal N(\mu, \sigma^2)$ with mean $\mu$ and standard deviation $\sigma$ means its probability density function is $$f(x) = \frac{1}{\sqrt{2 \pi} \sigma} e^{-\frac{(x-\mu)^2}{2\sigma^2}}.$$ For a continuous random variable $X$ with probability density function $f(x)$ and real numbers $a < b$, the probability that a random number generated by $X$ falls into the interval $(a, b)$ is $$\Pr(X \in (a,b)) = \int_a^b f(x) dx.$$
You may need the following properties of the problem:
The characteristics of a Gaussian distribution are: its density decreases exponentially from the mean to the left and right. Therefore, when the standard deviation is small, the value of the random variable is highly likely to be close to the mean. For example, in the context of this problem, $\mu = 0$ and $\sigma = 0.01$. The probability that the absolute value of a generated random number is greater than $0.04$ is approximately $6 \times 10^{-4}$, the probability that it is greater than $0.05$ does not exceed $6 \times 10^{-7}$, and the probability that it is greater than $0.07$ does not exceed $3 \times 10^{-12}$.