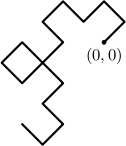
To test the functionality of his newly-purchased plotter, Byteasar decided to plot a few bytecurves. A bytecurve of order $ n $ consists of $2^{n} $ segments of length $\sqrt 2$ each. The first of them connects the points with coordinates $(0, 0)$ and $(1, 1)$. A bytecurve of order $ n $ can be described with a word $ L_{n} $ of length $2^{n}-1$ based on a two-letter alphabet {L, R}. The word's $ i $-th letter indicates that, after $ i $-th segment has been printed, the pen turns and moves orthogonally to the left (letter $\texttt{L}$) or to the right (letter $\texttt{R}$) to print the next segment. In other words, the pen changes its direction to the left or to the right by 90°.
$ L_{1} $ consists of a single letter L (left turn) and $ L_{2} $ consists of three letters LLR, indicating two left turns followed by one right turn. Inductively, $ L_{n} $ is generated from $ L_{n-1} $ in the following way: separate all letters in $ L $_{$ n $-1} with spaces and place an additional space in front and at the end of $ L_{n-1} $. Then, in the newly-created spaces, place alternating letters L and R, beginning with L. For example, $L_{3}$ is generated as follows: $ L_{2} = \texttt{LLR} \to \texttt{LLR} \to \texttt{LLRLLRR} = L_{3} $. Similarly, $ L_{4} = \texttt{LLRLLRRLLLRRLRR}$ (see the figure below).

It takes exactly one second to draw one segment of the bytecurve. While waiting for the plotter to complete printing, Byteasar ponders the following question: given a point ($ x $, $ y $) on the plane, when will the pen be positioned at that point? For example, for the bytecurve of order 4 in the above figure, the pen will be at point $(-3, -1)$ seven seconds after the beginning of plotting, and again eleven seconds after the beginning of plotting. Your task is to answer Byteasar's question.
Input Format
The first line of the input contains two integers, $ n $ and $ m $ ($1 \le n m \le 2\,000$), where $ n $ indicates that the bytecurve is described by $ L_{n} $ and $ m $ indicates that there are $ m $ query points. The next $ m $ lines each contain two integers, $ x_{i} $ and $ y_{i} $ ($-10^{9} \le x_{i}, y_{i} \le 10^{9}$), indicating the coordinates of the $ i $-th query point. Note that the coordinates in any particular input line are not guaranteed to represent a point on the bytecurve. Moreover, no point appears more than once in the input file.
Output Format
The output consists of $ m $ lines containing answers to the consecutive queries. Each answer consists of a nonnegative integer $ k_{i} $, specifying the number of visits the pen makes to the query point $(x_{i}, y_{i})$; followed by $ k_{i} $ nonnegative integers indicating the times of those visits in increasing order, in seconds since the beginning of plotting. Numbers should be separated by single spaces, and there should be no spaces at the beginning or end of a line.
Example
Input
4 3
-3 -1
1 1
-1 0
Output
2 7 11
1 1
0